Thursday, February 13, 2014

Potential Major Arctic Sea Ice Melt Season Coming - Record Low Sea Ice Extent for February 12, 2014

Usually in February and in March to come, the Arctic Sea ice reaches its greatest extent, area and thickness. However this season it is going through a major slow down in growth - actually declining some days in the last couple of weeks due to wind and temperature factors.

Here is today's NSIDC Sea Ice Extent for Feb 12, 2014, which appears to be in record low territory:
Source: http://meteomodel.pl/klimat/arcticice_nsidc.png

The IARC-JAXA graphic also depict a record low Arctic Sea Ice of 13,606,990 sq km:
Source: http://www.ijis.iarc.uaf.edu/en/home/seaice_extent.htm

The Cryosphere Today Arctic Sea Ice Area anomaly tells the story as well, depicting an anomaly one would more expect in August or September:
Source: http://arctic.atmos.uiuc.edu/cryosphere/IMAGES/seaice.recent.arctic.png

Jim Pettit posted the numbers for the IJIS Extent and CT Area on the Arctic Sea Ice Forum to summarise the records:

IJIS extent:

13,606,9902 (February 12, 2014)

Down 26,079 km2 from previous day
Down 75,0352 over past seven days
Down 9,7122 for the month-to-date

774,271 km2 below 2000s average for this date.
249,847 km2 below 2010s average for this date.
307,174 km2 below 2012 value for this date.

Lowest ever for the date (4th day this year in first place)
Fifth consecutive day, and 21st this year, among the lowest three years on record


CT Area:

12,586,1772 (February 12, 2014)

Down 34,896 km2 from previous day
Down 37,9302 over past seven days
Up 105,1302 for the month-to-date

771,425 km2 below 2000s average for this date.
204,177 km2 below 2010s average for this date.
89,816 km2 above 2012 value for this date.

Second lowest ever for the date.
Tenth consecutive day, and 12th this year, among the lowest three years on record
Source: https://forum.arctic-sea-ice.net/index.php?action=post;quote=20263;topic=743.50

How the ice thickness and extent compares to prior years seems to leave the multi-year ice more vulnerable to melt in 2014 than the last two years. Here is the comparison between Feb 22, 2012 and 2013 (actual) and 2014 forecast:


Source: http://www7320.nrlssc.navy.mil/hycomARC/navo/arc_list_arcticictn.html

At this point, this seems to leave the much of the multi-year ice in the Beaufort Sea for potential melt-out this season. Time will tell.

The Pineapple Express is Coming - and Sticking Around Through February 22 2014.

While the US West has been suffering increasing and in some areas, extreme drought, relief for the Northwest is on the way.

The Feb 11, 2014 Drought Monitor depicts the dire situation:
Source: http://droughtmonitor.unl.edu/

However, during the last few days and through the next 10 days, the Northwest will get drought relief, but it will likely result in flooding and wild weather, while increasing reservoir water levels. To illustrate the coming change - and problems, here is the last 7 days precipitation anomaly for February 6-12, 2014 and today's active watches and warnings:


Source: http://www.nws.noaa.gov/largemap.php

The green shading in the US Northwest represents flood watches and warnings.

The current satellite view reveals the "Pineapple Express," the flow of moisture (atmospheric river) starting near Hawaii and aimed at the US Northwest, that seems likely remain in place to dump rain and snow for the next 10 days.

Source: http://www.ssd.noaa.gov/goes/west/nepac/rb-l.jpg

NOAA's ERSL (Earth System Research Laboratory) launched a study of the "atmospheric rivers" in the Pacific this month, and is flying aircraft to study the phenomena: See http://www.esrl.noaa.gov/psd/atmrivers/

The Climate Prediction Center put out the following forecasts on February 12, 2014, for temperature and precipitation. First the 3-7 day forecast:

Source: http://www.cpc.ncep.noaa.gov/products/predictions/threats/hazards_d3_7_contours.png

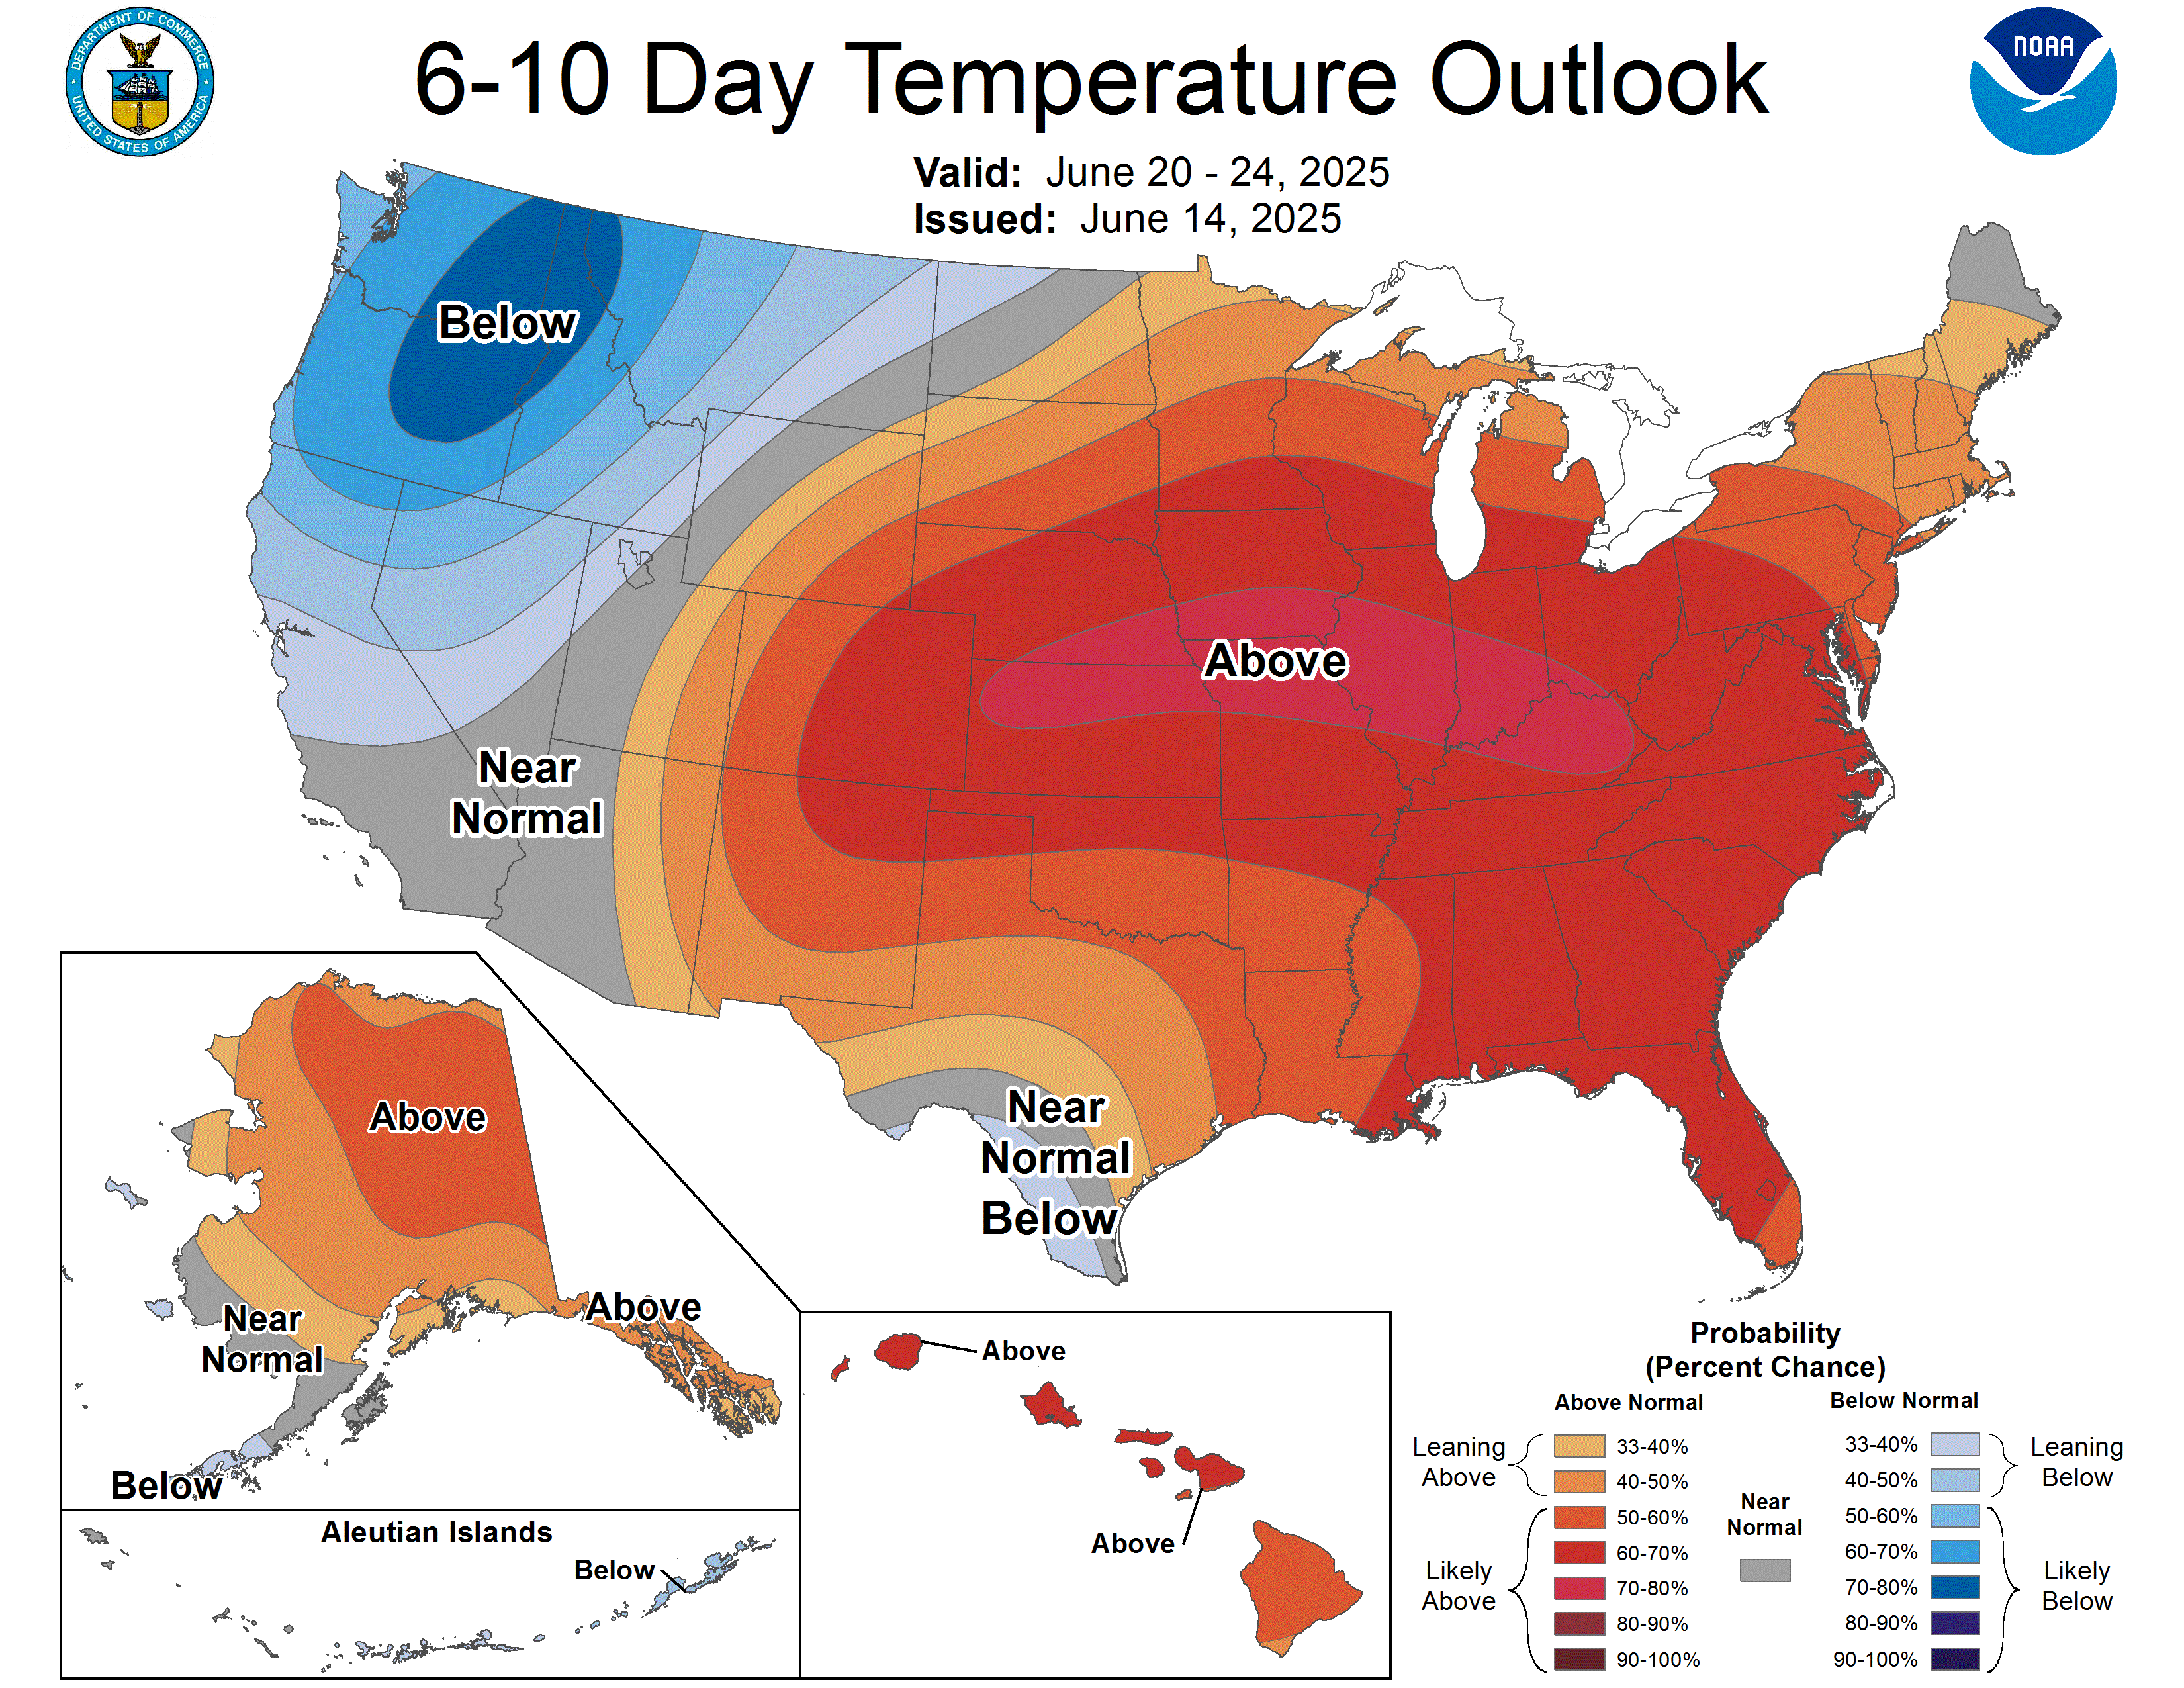
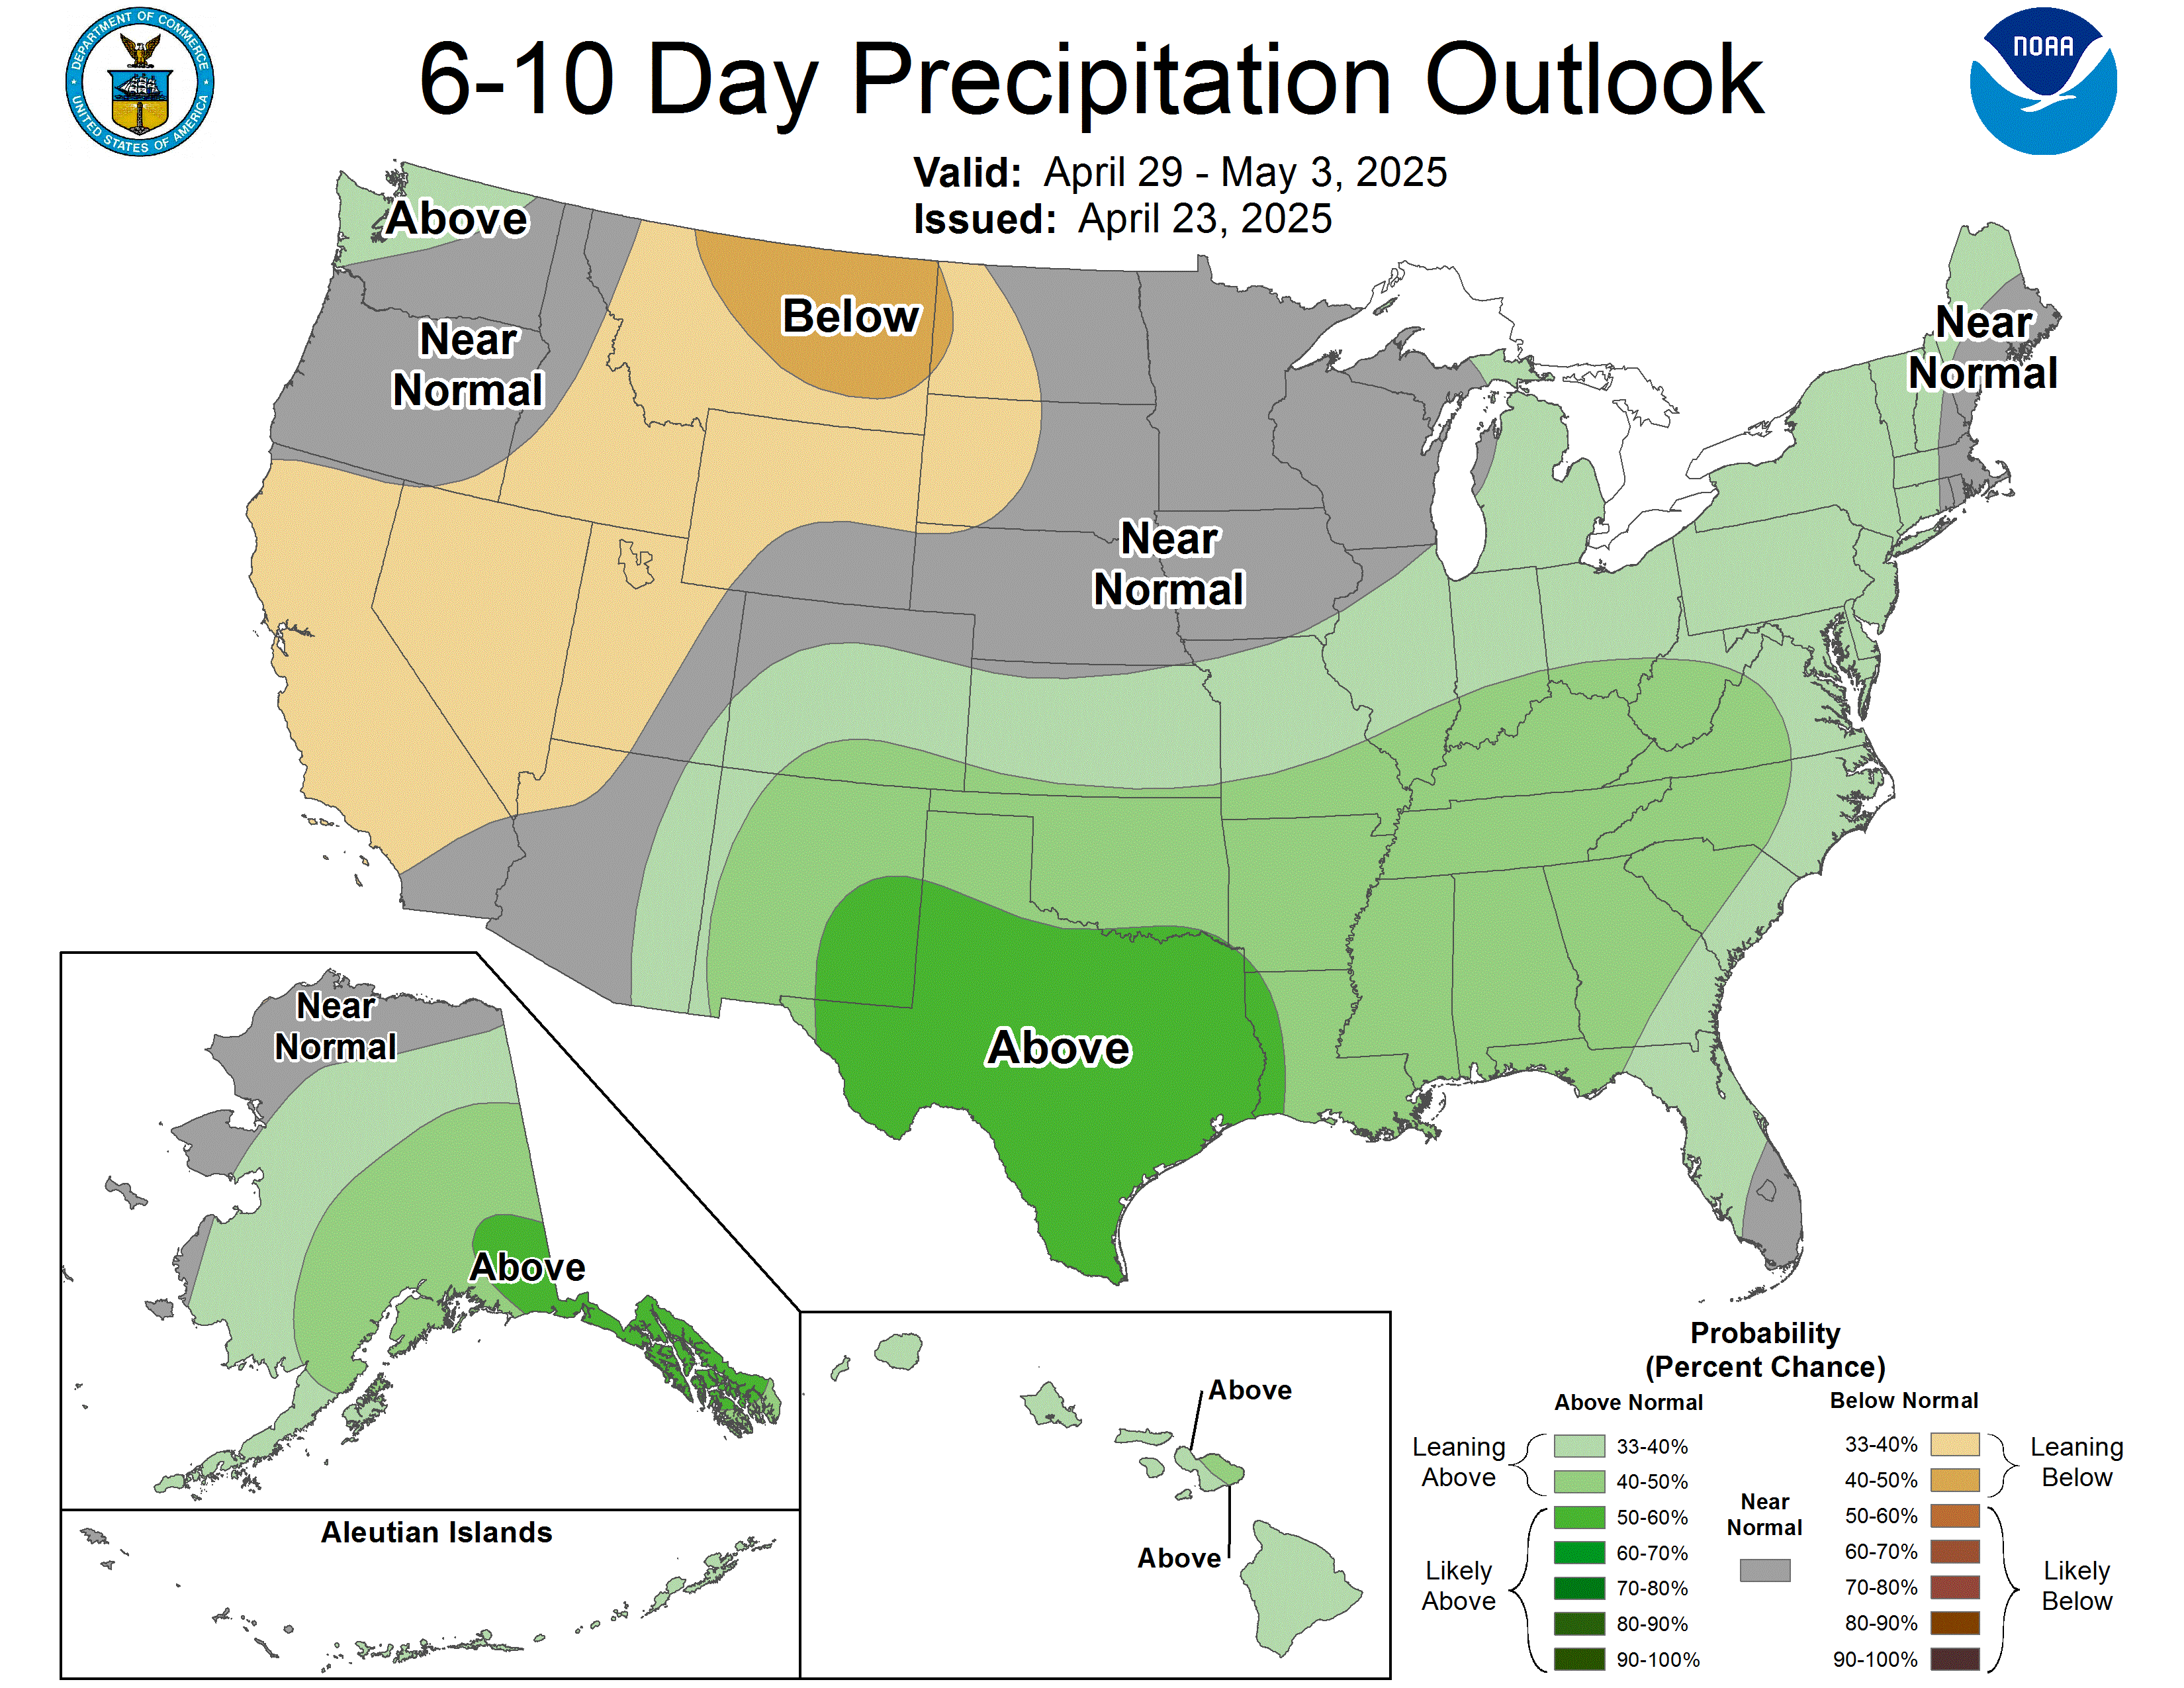
Note the waves, snow, and wind for the northwest coast through February 19th. However the impacts goes farther than that in the models. Here is the 6-10 day forecast for February 18-22, 2014 for temperatures and precipitation:


Source temperature: http://www.cpc.ncep.noaa.gov/products/predictions/610day/610temp.new.gif
Source precipitation: http://www.cpc.ncep.noaa.gov/products/predictions/610day/610prcp.new.gif

Both predict warmer that normal temps for the Central and Eastern US, which will have an impact on snow melt and perhaps result in the flooding in the East.

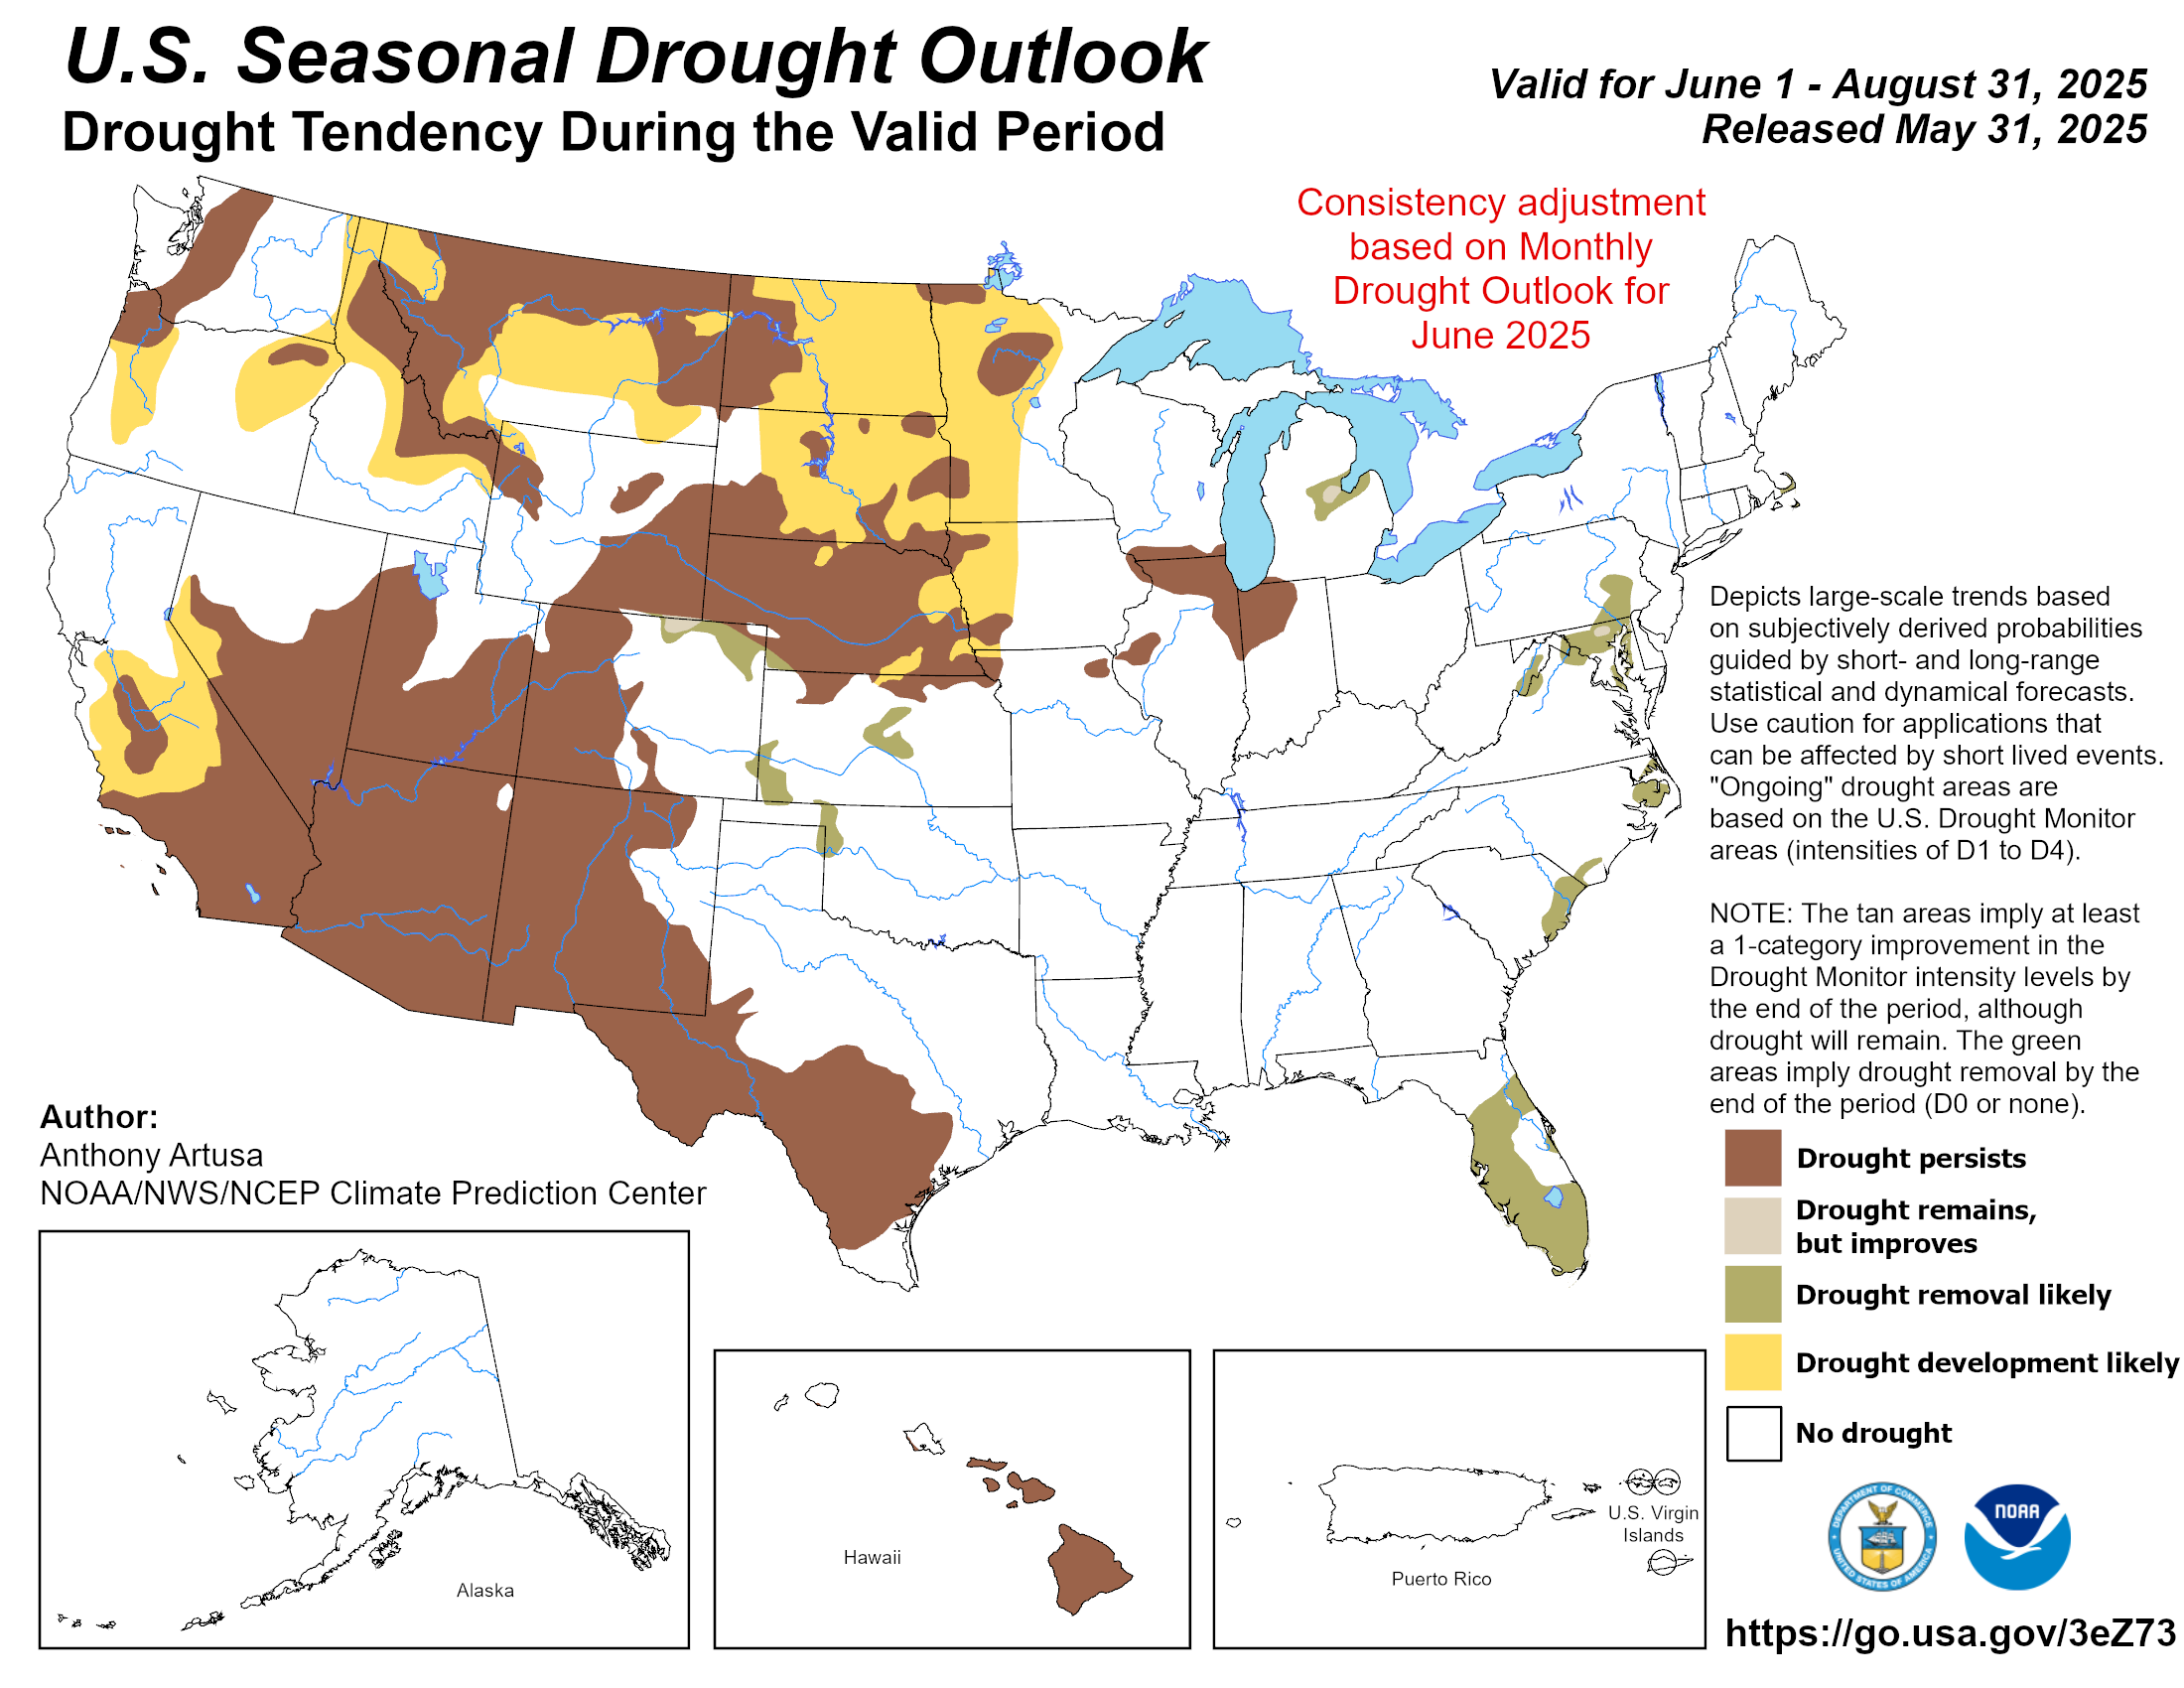
The big problem: This has very limited impact on relieving the California or Southwestern US drought. The seasonal outlook still has drought continuing or intensifying through April 30, 2014

Source: http://www.cpc.ncep.noaa.gov/products/expert_assessment/season_drought.png

Sunday, February 9, 2014

UK Storms: "All the evidence suggests there is a link to climate change." Dame Julia Slingo

The UK MET Office has issued a report on the recent extreme UK and global weather. Prior to the issuance of the report, Dame Julia Slingo, chief scientist of the MET, gave an interview in which a few excerpts are included in a February 9 BBC article.
 She stated that, "all the evidence suggests there is a link to climate change," and "there is no evidence to counter the basic premise that a warmer world will lead to more intense daily and hourly rain events."

According to the BBC, she also commented that "the UK had seen the "most exceptional period of rainfall in 248 years".

Unsettled weather at this time of year was not unexpected - but the prolonged spell of rain, as well as the intensity and height of coastal waves, was "very unusual".
"We have records going back to 1766 and we have nothing like this," she said. "We have seen some exceptional weather. We can't say it is unprecedented but it is exceptional."

See: Met Office: Evidence 'suggests climate change link to storms' ,
 
What is of real interest, in relation to the previous blog post, is the report's support for the mangled jet stream and Rossby waves that are deemed the main contributors to the North American and UK weather extremes, linked to the warmer West Pacific sea surface temps.
 
The MET blog states,
 
"The severe weather in the UK coincided with exceptionally cold weather in Canada and the USA. These extreme weather events on both sides of the Atlantic were linked to a persistent pattern of perturbations to the jet stream, over the Pacific Ocean and North America.
 
The major changes in the Pacific jet stream were driven by a persistent pattern of enhanced rainfall over Indonesia and the tropical West Pacific associated with higher than normal ocean temperatures in that region. The North Atlantic jet stream has also been unusually strong; this can be linked to exceptional wind patterns in the stratosphere with a very intense polar vortex."
 
 
The UK MET report, pp. 12-13, provides the details:
 
"During December and January 2013/14 the pattern of winds over the North East Pacific and North America was very disturbed (Figure 13, right panels). The North Pacific jet was deflected a long way north, with a secondary branch extending southwards into the tropical Pacific accentuating the separation of the Pacific and Atlantic jet streams. The effects of this over North America and into the North Atlantic were profound. The deflection of the jet to the north led to colder air being carried south over Canada and the northern US ... to enter the North Atlantic jet and establish a stronger than normal temperature gradient at the entrance of the North Atlantic Jet. This acted to strengthen the jet and provide the conditions for active cyclogenesis, which in turn led to a sequence of strong storms across the UK throughout December and January ... the North Atlantic jet was, on average, as much as 30% stronger than normal. 
 
In regard to Rossby Waves interaction with the jet streams it comments in page 17, "As is evident in Figure 13, the ‘buckling’ of the jet stream over the Pacific and North America became much more pronounced during January 2014, as the precipitation anomaly over Indonesia and the West Pacific strengthened (Figure 17). A notable feature of this anomalous area of tropical precipitation is its northwards extent into the winter hemisphere where it is able to interact with the North Pacific jet and generate Rossby waves6 that propagate along the jet and act to reinforce the huge meander of the jet stream off the west coast of North America. At the same time, Rossby waves propagate along the southern branch of the jet stream and enter the tropical East Pacific through the westerly duct, creating weather disturbances that can then get caught up in the entrance region of the Atlantic jet stream.
 
These Rossby wave interactions are very complex but appear to be fundamental to understanding this winter’s weather."
 
In regard to the Polar vortex, it notes on page 19 the elongation and also the wind speeds,
 
"Above the troposphere, westerly winter winds in the polar night jet stream9 were very strong during December and January. The polar night jet exceeded twice its normal strength at times during the winter, reaching speeds in excess of 100ms-1 in the upper stratosphere. A strengthening of the polar night jet often precedes periods of a strong Atlantic jet stream below and a positive North Atlantic Oscillation pattern, as was seen during the whole December to January period and consistent with the increased winter storminess this year."
 
Continuing on page 20, "In terms of the recent extreme cold event over Canada and the US, the evidence suggests that the polar vortex has been stronger than normal, consistent with the increased winds in the polar night jet; the structure of the vortex has also been stretched with the core of the vortex extending southwards over Canada (Figure 19)."


Saturday, February 8, 2014

Bi-Polar, Quadri-Polar and Meandering Jet Streams - Feb 8, 2014

Much has been mentioned about the meandering or mangled jet streams and their impact on the cold waves into North America on snow and Arctic temps in the US. At the same time parts of the Arctic are substantially warmer than areas farther south.

The following looks at how the circulation changes by mb/hpa in the atmosphere on February 8, 2014 to illustrate how mangled the troposphere really is. We start at the highest level and work our way down toward the surface, focused on the Northern Hemisphere.

At 10 hpa/mb, the tropospheric winds appear bi-polar - circulating around two main polar points - one over Siberia, the other the Canadian Arctic. However, two other vortices appear which seem to be influencing this elongation pattern, one over far eastern Siberia and the other over Atlantic off northwest Spain.
http://earth.nullschool.net/#current/wind/isobaric/10hPa/orthographic=-358.75,80.29,441

The two supporting vortices over the Pacific and Atlantic sides seem to weaken at 70 hpa/mb, leaving the polar vortices the dominant influences at this altitude. This changes as we drop further into the troposphere.

http://earth.nullschool.net/#current/wind/isobaric/70hPa/orthographic=-358.75,80.29,441

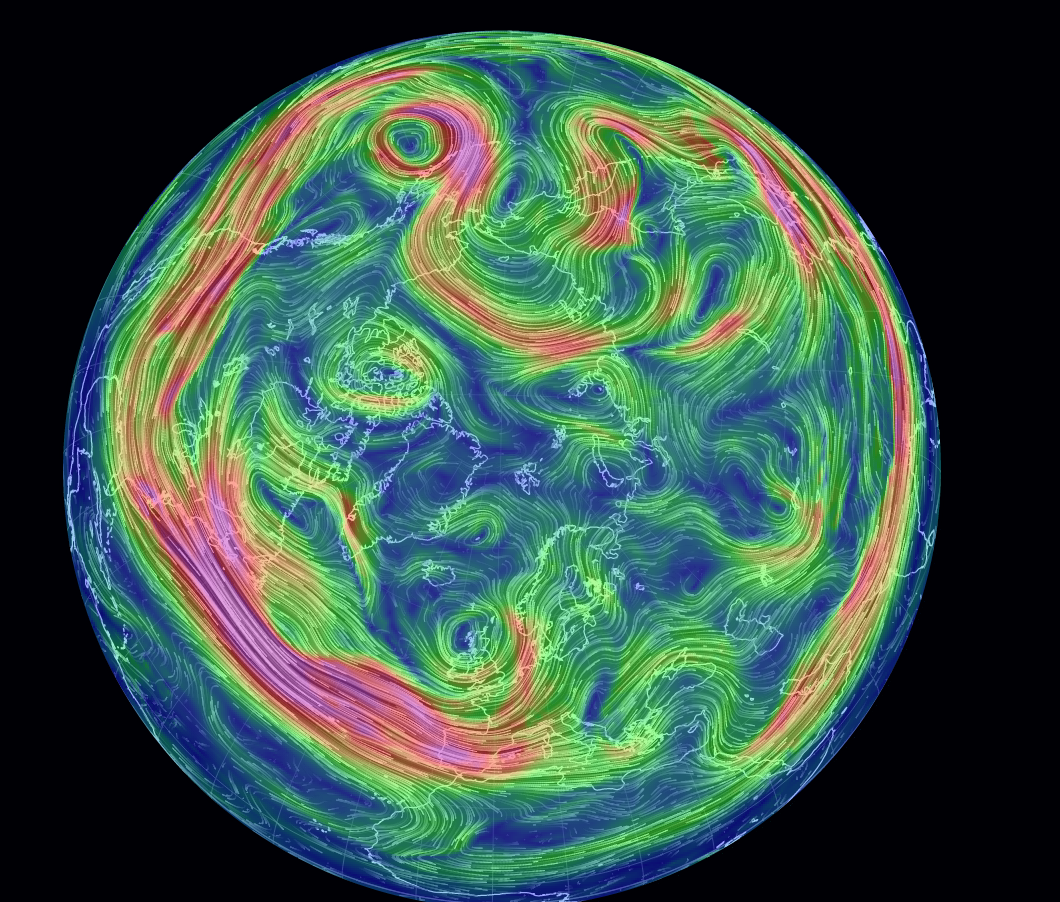
At 250 hap/mb, the mangled upper atmospheric steering currents become graphically apparent. The twisted curves and collision of the polar and mid latitude jets vary as one rotates around the planet. What follows are three views at 250 hpa/mb.

The first is roughly centered over the NH, and the polar and mid-latitude jet stream collision over North America is very apparent. But the real polar vortex breakdown, on Feb 8 is the breakout over central Asia, which is likely contributing to the major cold over central Asia.

The polar view below reveals the looping meanders of steering currents that are delivering weird weird weather across the Northern Hemisphere.
http://earth.nullschool.net/#current/wind/isobaric/250hPa/orthographic=-358.75,80.29,441

Shifting perspective to 250 hpa/mb over Europe, the jet stream flow from off the South American coast into Africa, and then into Asia is apparent, pulling moisture into Africa.

 http://earth.nullschool.net/#current/wind/isobaric/250hPa/orthographic=-358.75,80.29,441

Rotating the 250 hpa/mb view to the Pacific, one sees the reason for the major incursion of warmer air into the Arctic over Siberia, as the polar jet streams up into the Arctic, then loops back into the Pacific in interaction with the sea surface temperature anomaly in the northeast Pacific.
 http://earth.nullschool.net/#current/wind/isobaric/250hPa/orthographic=-358.75,80.29,441

From the perspective of Central Asia (below), the mid-latitude jet appears generally "nomral", however, the Arctic jet stream double dips into Siberia, helping to hold the polar air mass in place, but also bringing unseasonable cold to areas of central Asia and into the Pacific, attested by the unusual snow storm in Tokyo.
 http://earth.nullschool.net/#current/wind/isobaric/250hPa/orthographic=-358.75,80.29,441

At 500 hpa/mb, the pattern again is meandering with a cutoff circulation in the Canadian Arctic. The low pressure affecting the UK is now quite visible, as well as the strong low in the North Pacific, that is feeding off circulation from the Arctic basin.
 http://earth.nullschool.net/#current/wind/isobaric/500hPa/orthographic=-358.75,80.29,441

When viewed from the Pacific, the 500 hpa/mb mid-latitude jet streams across south Asia and into the Pacific as generally expected. The Polar Jet writhes across Siberia and Asia like a dying snake.
 http://earth.nullschool.net/#current/wind/isobaric/500hPa/orthographic=-358.75,80.29,441

The 500 hpa/mb jet reconstitutes over Korea and is driving the cold weather into Japan before abruptly turning north into the Pacific then turning northwest into eastern Siberia before looping over the East Siberian Sea, providing the steering for anomalously warm air masses into eastern Siberia before wrapping around the low in the northern Pacific.  

The Polar view of the 500 hpa/mb jet stream in the NH looks like a Van Goh painting run amok.
http://earth.nullschool.net/#current/wind/isobaric/500hPa/orthographic=-358.75,80.29,441

The 750 hpa/mb view reflects the steering currents at the upper levels of the troposphere. While the jet seems normal across the US - bringing rain and snow into California and Oregon - now turning into flooding after drought in northern California, but also directing storms across the Northeastern US - which does not need more. What is of concern is how the jet falls apart as it gets into Europe.

The 1000 hpa/mb depicts the same pattern, even more obvious glaring absence of major wind flow across Europe.

The surface wind pattern is focused on the storm currently bashing the UK. However, my conclusion is that this mangling does reflect the larger dynamics at work - that warming is resulting in disruption. As a point to this survey, it is 25F where I am in the US. It is 32 F/0 C in Tunu, Greenland.