Wednesday, December 28, 2016

Arctic Heatwaves Storms and Sea Ice Impacts, Dec 14-28, 2016

The last two weeks witnessed exceptional events in the Arctic, with warming, storms, and sea ice decline damaging the sea ice pack. The change in sea ice extent on the Atlantic side of the Arctic was stunning for this time of the season.

On December 21st, the NSIDC reported a sea ice extent decline of 148,000 km2. Sea ice extent continues to set record lows with the possibility that we end the year at the lowest recorded for that date.
Source: Jaxa

However this process of temporary heatwaves and storm induced compaction and perhaps, given the wave action, some ice melt, only helps reaffirm how weak this ice pack is compared to past decades. 

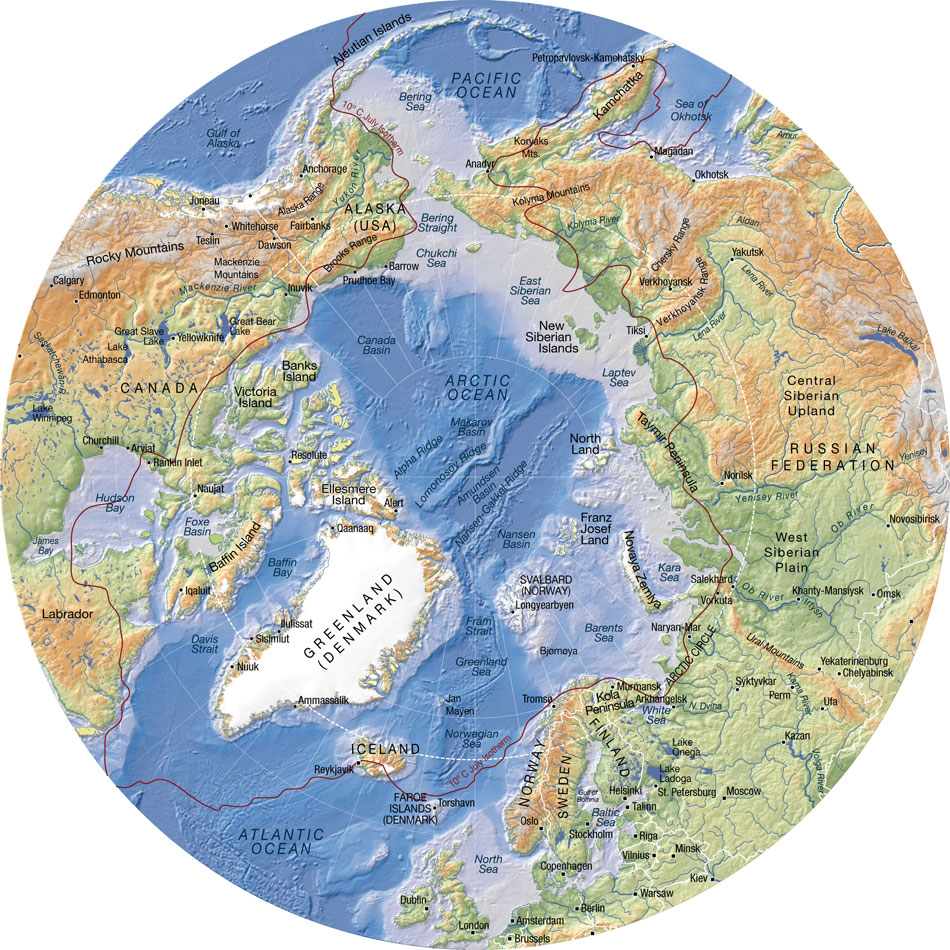
To illustrate, we will track the Arctic changes prior to the storm and warmth till December 28, 2016. However, first here is an Arctic map to assist with location finding.

Source: https://nordpil.com/static/images/arctic_topographic_map_full.jpg

What follows mostly comes from the EOSDIS World View Sea Ice Concentration Layer interspersed with other charts by date to illustrate the drop, the heatwave and then the fast expansion of extent and concentration changes since the strongest storm passed on the 23rd.

December 1, 2016

Beginning with December 1, 2016, below, we observe the Franz Joseph Islands nearly surrounded by sea ice as the pack continues to expand. Areas of the Kara Sea remain ice free due to ocean warmth slowing refreeze.

To illustrate that sea surface temperature anomaly slowing refreeze here is the NOAA EMC SSTA for December 1st:


Source: http://polar.ncep.noaa.gov/sst/ophi/archive/20161201/color_anomaly_NPS_ophi0.png

December 14, 2016

The image below for the 14th reveals the sea ice extent and concentration just before a series of storms and wind change that reversed the winter expansion on the Atlantic side. The concentration anomaly in the Central Arctic Basin remains though somewhat diminished.


December 22, 2016

The imagery for the 22nd reveals the impact of the winter storm, wave action, and strong winds impacting the sea ice. The pact around Franz Joseph Land has been shredded, and north of Svalbard concentration has dropped.


The wind and temperature impacts for the 22nd are apparent in the earthnullschool imagery. The low passing west of Svalbard pulled the warmer air flowing from the south into the Central Arctic Basin, and that combined with the winds exceeding 50 mph swirled over the pack from northern Russia.

Source: https://earth.nullschool.net/

December 23, 2016

The strong low pulled the mid-latitude air over the Pole, with temperature anomalies that were 20-30 C above normal, a couple of brief hours hovering at 32 F.

 Source: Climate Reanalyzer

December 24, 2016

Christmas Eve revealed the furthest retreat of the sea ice edge and obliteration of ice around Franz Joseph Land, with the additional weakening of the sea ice inside the pack appearing as yellow areas with about 75% ice. The storm, wind and wave impacts were ending, and with that, refreeze would begin rapidly.


December 28, 2016

During the last four days, much of the extent lost has been recovered - but with thinner ice that will continue to suffer the effects of wind, warmth and waves. Concentration in the Central Arctic is still ragged, with a pack on the move through the Fram Strait being impacted by current and future wind and storm. First, here the EOSDIS sea ice concentration for the 28th.

Source: https://worldview.earthdata.nasa.gov/

Here is the Magic Seaweed forecast for waves and storm impacts for today as of 1800 hours, Areas in yellow and orange represent wave heights over 20 feet.


Source: magicseaweed.com

Warmth still streams north along with this storm, here is a more local view first, then the "conveyor belt" of air flows that keep pummeling the Arctic over the next several days with moisture and warmth from the mid-latitudes. Areas in green and yellows are above freezing. Blue and fucia/purple are below freezing.


Source: EarthNullSchool

Finally, here is the wave forecast for January 1, 2017, which conveys that what we have witnessed as warm stormy conditions impacting Arctic sea ice will likely continue into January. The light blue and aqua still represent wave heights of 10-18 feet.

Thus, we begin 2017 with a weakened pack, that continues to be a shadow of its former strength. This state is reinforced by the recent AGU Norwegian Young Sea Ice (N-ICE2015) project presentation.

As Mats Granskog, a sea-ice researcher at the Norwegian Polar Institute in Tromsø and chief scientist of the Norwegian Young Sea Ice (N-ICE2015) project, presented at the AGU conference, there were...

“Lot’s of surprises. We saw a new Arctic where the ice is much thinner, only three to four feet thick and this ice functions much differently than it did five to ten years ago when the ice was much thicker.”

“We were also surprised that there was so much snow on the ice. Way more than we expected from earlier work."

“We observed the first northern most under sea ice phytoplankton bloom very early in the season when the ice was still snow covered. It was only this new Arctic ice, very mobile ice, that allowed this to happen."

"So we can say that this thinner and younger ice today works very differently than the ice we knew. It moves much faster. It breaks up more easily. It is way more vulnerable to storms and winds."

“The so called Arctic Amplification, the rapid warming of the Arctic, is in part caused by a reduction in the Arctic sea ice, seen in the last decade. And this has already impacted the patterns of weather and climate on the planet.”

"It is disturbing that the accelerated warming in the Arctic actually feeds more warming in the Arctic, and can even result in more drastic changes. And these drastic changes in the Arctic sea kind of calls into the question the knowledge that we have today about Arctic sea ice.”

Source: Youtube AGU https://www.youtube.com/watch?v=Fq-d6RjPjoQ&t=774s

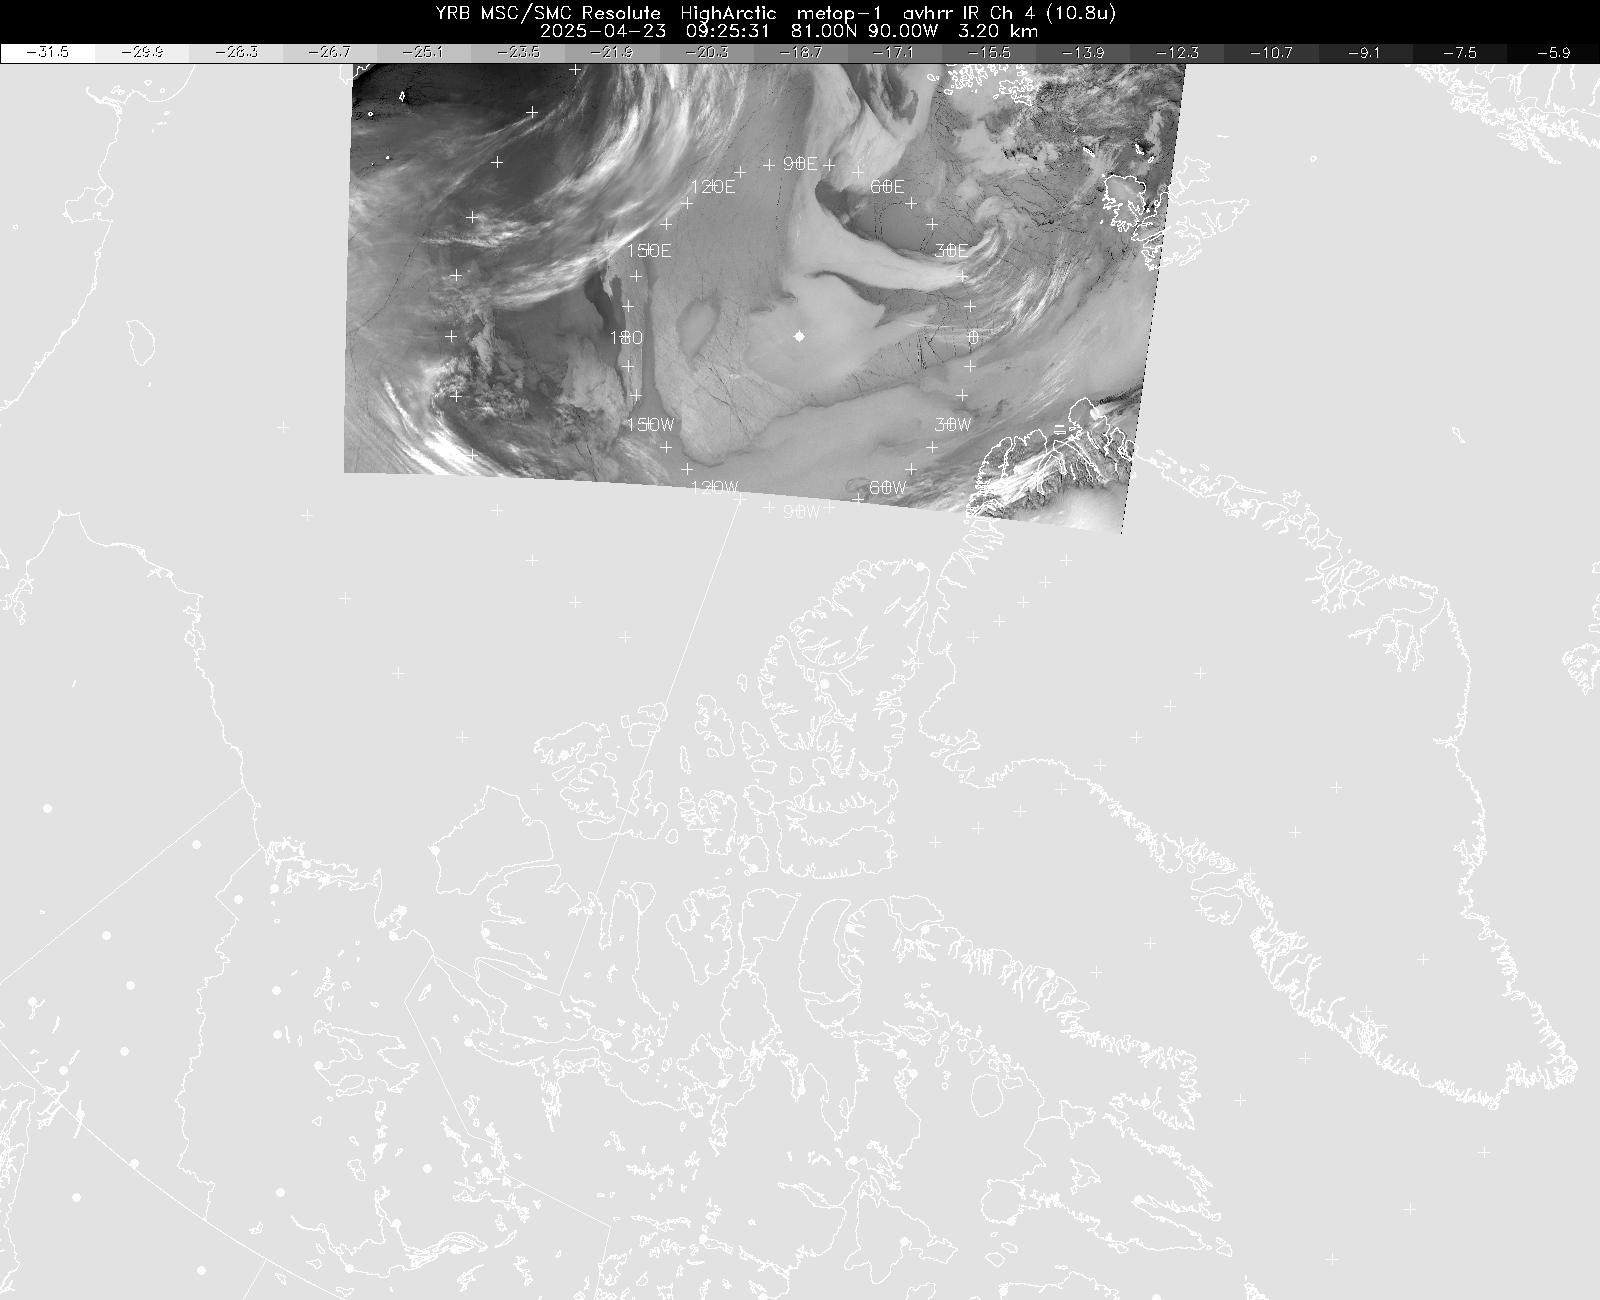
To visualize his description, here is a glimpse of the current ice conditions, note the leads through the Central Arctic basin.

Finally a closeup glimpse of the Nares Strait, and fracturing through the older sea ice in the Canadian Arctic.
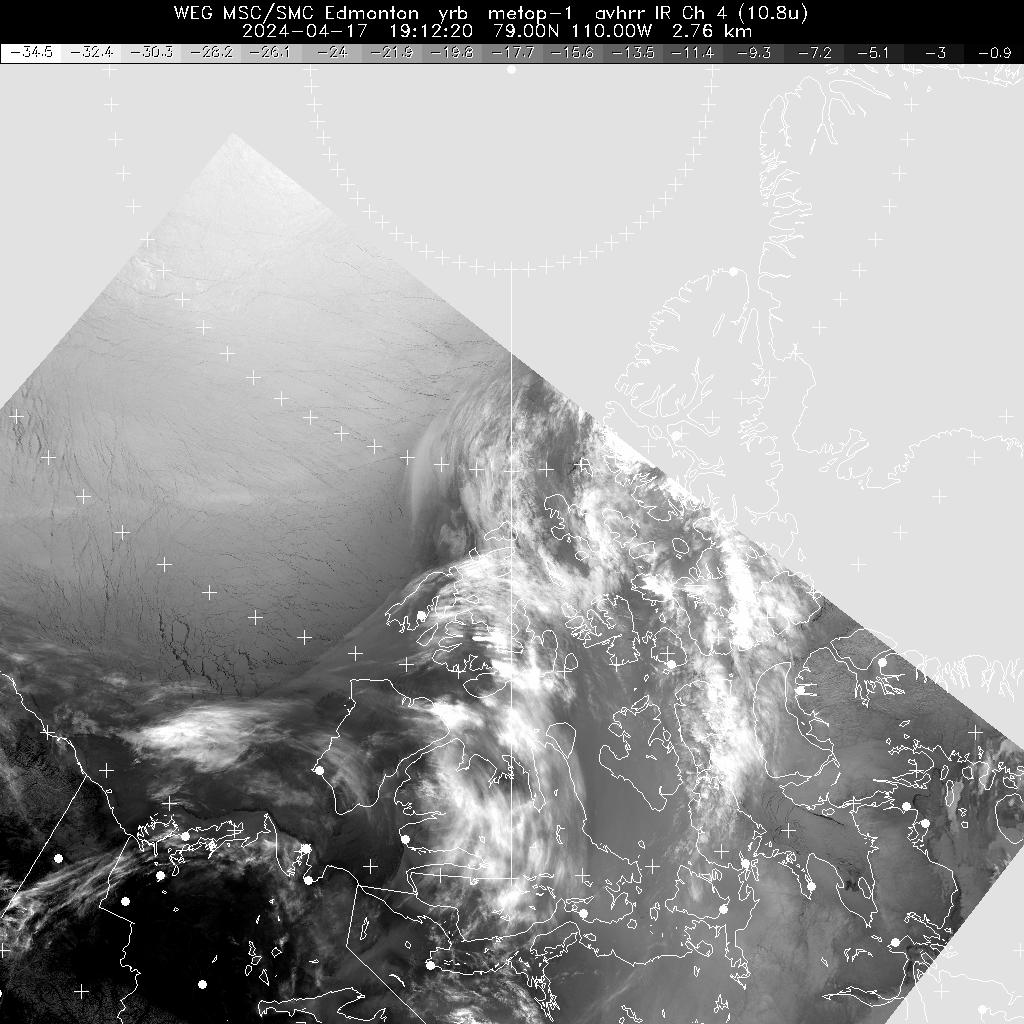

Source: Environment Canada

Monday, September 19, 2016

Siberia Swathed in Choking Smoke

Siberia and over 1,000 miles of Russian skies are swirling with smoke and fog so thick that the ground cannot be seen for 100's of miles in EOSDIS imagery on September 19.


Source NASA EOSDIS

In comparison, here is the July 19, EOSDIS imagery which caught earlier media attention. While covering a larger area, it was not as thick.


One of the contributing factors to the Russian fire season is severe drought that has lasted for years in part of the Russia taiga and Arctic. Here is the 6 month drought map from CSIC SPEI


In comparison, here is their 48 month drought map.
Source: CISC SPEI

Sunday, August 28, 2016

Great Arctic Cyclone(s) of 2016 Vaporizing Arctic Sea Ice

During the past two weeks, wave after wave of surface low pressures have been spinning up storms over the Arctic Ocean. The impact, especially in the last week, has been breaking up Arctic sea ice, resulting in significant drops in ice extent and area.

While the storms brought cloudiness, they increased wave action and bottom melt which have broken up floes and left them vulnerable to flash melting across large areas.

Here are two views of the Arctic Ocean on August 11, early in the storm process, one from EOSDIS Worldview GCOM-W1/AMSR2 imagery and the other from Polar View from the University of Bremen.

Source: EOSDIS Worldview

Source: Polar View, University of Bremen: http://www.iup.uni-bremen.de:8084/amsr2/Arctic_AMSR2_nic.png

Both depict from breaking up of the pack typical of August, but much ice seems to be relatively ready to survive until the September minimum concentration and area.

However as the storms wound up, causing wind-driven rotation of the pack, wave action began shattering floes and bringing the ice in contact with warmer subsurface water stirred by wave action resulting in continued melt. 

By August 22, these effects were obvious, with the sea ice arm stretching into the Laptev, East Siberian and Chukchi seas dispersing and melting as it turned. In addition the "bite" into the heart of the pack continued to deepen. 

Source: EOSDIS Worldview

Source: Polar View, University of Bremen: http://www.iup.uni-bremen.de:8084/amsr2/Arctic_AMSR2_nic.png

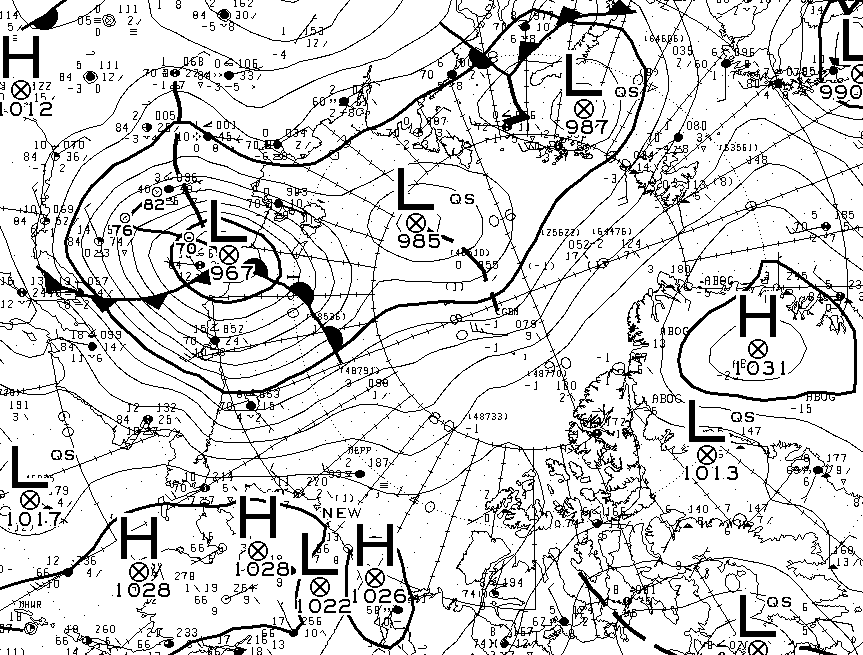
During the last week, continually reinforced surface low pressure centers have gone as low as 967 mb, like this storm center emerging from the Siberian coast August 27th.

Source: Environment Canada

The higher waves and swells have occurred and are forecast to be as high as 2-3 meters near the storm center, which is currently expected to remain about 970-972 millibars in strength for the next 18 hours.

Source: Environment Canada

August 28 observation of Arctic SLP and wind flow.

Forecast August 28, 2016 0000z Source: Environment Canada

The impacts of wave, wind and ocean warmth are apparent in the August 27 imagery. The "Wrangel Arm" has withered and the breakup of ice extends well into the remaining pack. Additionally the flow along Greenland's coast and into warmer waters by some of the pack will lead to further drops in area and extent through September until the minimum.

Source: EOSDIS Worldview

Source: Polar View, University of Bremen

The inflow into the storm center continues to draw in warm moist air which accelerates melt. Winds as high as 30 knots are flowing almost to the North Pole, and flushing ice into warmer waters of the North Atlantic.

Source: Earth Nullschool

While it is quite unlikely we will break the 2012 lows, it seems 2016 is on its way to breaking 2007's extent and area hold on second place.
Source: Arctic ROOS http://arctic-roos.org/observations/ice-area-and-extent-in-arctic

Source: Arctic ROOS http://arctic-roos.org/observations/ice-area-and-extent-in-arctic

Who knows what the rest of this Arctic melt season has in store, but the mix of higher sea surface temperatures, storms and waves may slow sea ice development and lead to another low sea ice maximum next spring.


Sources: Coral Reef Watch  5km SST Anomaly and Climate Reanalyzer Sea Ice. August 26-27, 2016.

The image gives a glimpse of the global climate "heartburn" this incredible year has brought. 

Wednesday, August 17, 2016

June Global CO2: Record Accelerating Increases

The ESRL Global Monitoring Division global CO2 report released August 5th places us again in record territory for CO2 levels, but even worse - with record increasing rates of release.


Source: http://esrl.noaa.gov/gmd/ccgg/trends/global.html

A longer time base depicts the ever increasing trend of atmospheric concentration experienced since 1980.


Source: NOAA ESRL: ftp://aftp.cmdl.noaa.gov/products/trends/co2/co2_mm_gl.txt

June 2016's global average of 403.57 ppm is 3.78 ppm above June 2015, a record year to year increase, surpassing September 1998's 3.58 ppm increase, and July, 2013's increase of 3.48 ppm.

It is this ongoing increase of CO2 rates of concentration that creates sobering concern for our future.

For example, in 1998, the months of August to October recorded increases of more than 3 ppm over prior year. June to August, 2013, also were months experiencing more than a 3 ppm jump over the prior year.

However, in 2016 every month - January to June - has had a year to year increase of over 3 ppm, culminating in June, 2016 with the new record increase of 3.78 ppm, something never witnessed in the ESRL data.


Year Month  CO2 ppm 1 Yr Chng
2016 1 402.32 3.02
2016 2 402.95 3.09
2016 3 403.48 3.18
2016 4 403.99 3.30
2016 5 404.24 3.60
2016 6 403.57 3.78

Source: NOAA ESRL

However, while year to year data will show significant fluctuation, generally around ENSO changes, what is more troubling are the persistent accelerating rates of change over time. 


Five Year CO2 Increase - A New Accelerating Record

The June, 2016 CO2 increase over June 2011, was 12.63 ppm, the highest 5 year change recorded, To highlight the increasing rate of change, we had never experienced a five year increase of more than 10 ppm before September, 2002, when we observed a 10.23 ppm jump over 1997. From May, 2005 till April, 2008 - only 4 months had an increase less than 10 ppm. After that, the five year increase rate bounced above and below 10 ppm till March, 2013.

Since March, 2013, for 39 months, we have not experienced a increase of less than 10 ppm in any month compared to five years before. What is worse is that we observed our first months above 11 ppm in July to August 2014, over the same months in 2009. 

But that has been eclipsed by the trend beginning in December, 2015, when each month since - seven months in a row - have been above a five year increase of 11 ppm. That has been surpassed as well, for March to June 2016, have all had a five year increase above 12 ppm, with June setting a new record of a 12.63 ppm increase over June, 2011.


Year Month  CO2 ppm 5 Yr Chng
2015 12 401.42 11.23
2016 1 402.32 11.58
2016 2 402.95 11.80
2016 3 403.48 12.02
2016 4 403.99 12.15
2016 5 404.24 12.37
2016 6 403.57 12.63

Source: NOAA ESRL

Ten year CO2 Increase - Another New Accelerating Record

The June, 2016 CO2 increase from June, 2006 was also the highest recorded - 22.02 ppm. Our first month of over a 20 ppm increase in a 10 year period was September, 2007, when it hit, 20.17 ppm. Four of seven months from then till March, 2008 were above a 10 year increase of 20 ppm. 

From October, 2010 till May, 2012 all but three months were above a 20 ppm increase over the same month 10 years before. 

Since October, 2012, for 43 months, no month has witnessed an increase under 20 ppm.

The first time we observed a month with over a 21 ppm increase was December, 2015, and amazingly, 6 months later, we have gone over a 22 ppm increase. 


Year Month  CO2 ppm 10 Yr Chng
2015 12 401.42 21.08
2016 1 402.32 21.23
2016 1 402.95 21.24
2016 1 403.48 21.36
2016 1 403.99 21.53
2016 1 404.24 21.83
2016 1 403.57 22.02

Source: NOAA ESRL

The following graph illustrates the entire set of trends.
Source NOAA ESRL: ftp://aftp.cmdl.noaa.gov/products/trends/co2/co2_mm_gl.txt

Our recent jump is often described as a "product" of the recent El Nino, but more specifically, it is a result of increasing drought, forest fires, and more menacing - the decreasing capacity of the oceans to absorb carbon as they experience heating. These are anticipated to continue and increase as the more global warming occurs. 

While these increase rates may drop in the coming months, as the effects of El Nino fade, we may be witnessing new baselines laid for future acceleration. Given that since 2003, we have experienced six monthly year to year peak increases well over 2 ppm, and since 2006, ever increasing peaks in that monthly CO2 change, it seems likely, that in the next 5 years, we will experience a month with a year on year CO2 increase of 4 ppm.