The following looks at how the circulation changes by mb/hpa in the atmosphere on February 8, 2014 to illustrate how mangled the troposphere really is. We start at the highest level and work our way down toward the surface, focused on the Northern Hemisphere.
At 10 hpa/mb, the tropospheric winds appear bi-polar - circulating around two main polar points - one over Siberia, the other the Canadian Arctic. However, two other vortices appear which seem to be influencing this elongation pattern, one over far eastern Siberia and the other over Atlantic off northwest Spain.

The two supporting vortices over the Pacific and Atlantic sides seem to weaken at 70 hpa/mb, leaving the polar vortices the dominant influences at this altitude. This changes as we drop further into the troposphere.

At 250 hap/mb, the mangled upper atmospheric steering currents become graphically apparent. The twisted curves and collision of the polar and mid latitude jets vary as one rotates around the planet. What follows are three views at 250 hpa/mb.
The first is roughly centered over the NH, and the polar and mid-latitude jet stream collision over North America is very apparent. But the real polar vortex breakdown, on Feb 8 is the breakout over central Asia, which is likely contributing to the major cold over central Asia.
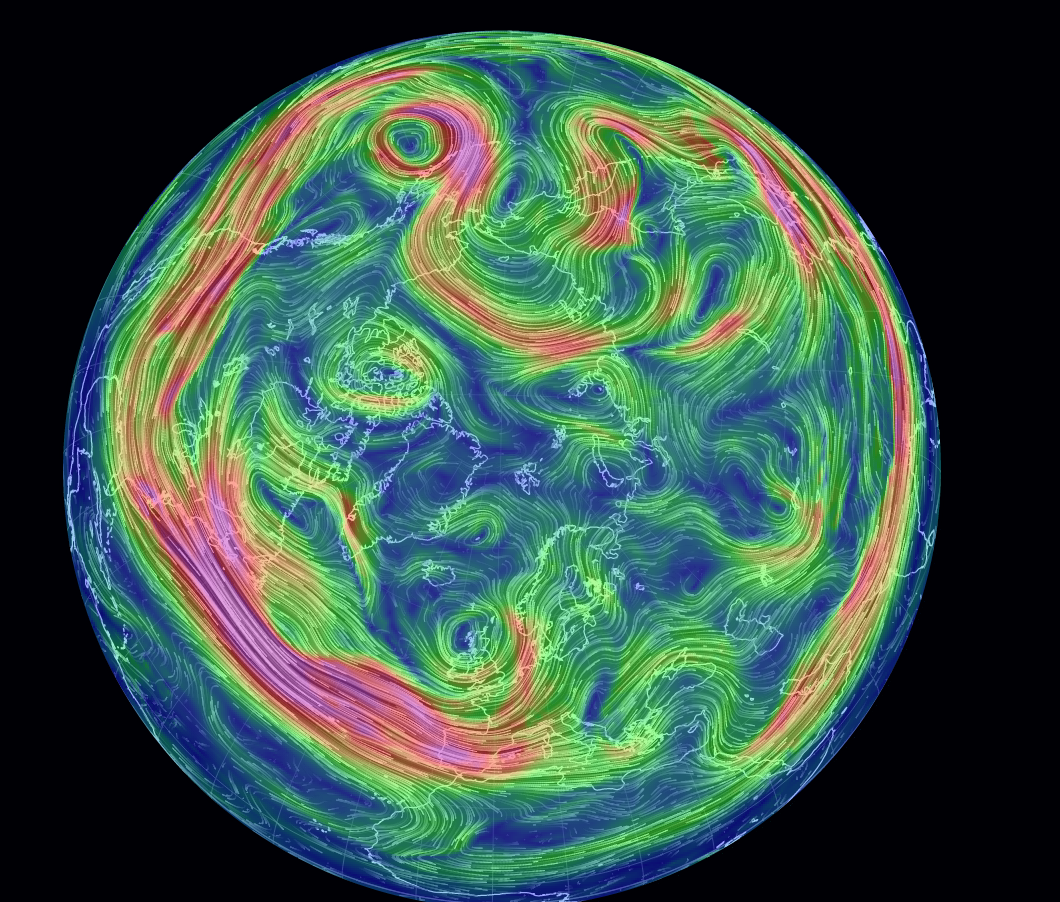
The polar view below reveals the looping meanders of steering currents that are delivering weird weird weather across the Northern Hemisphere.

Shifting perspective to 250 hpa/mb over Europe, the jet stream flow from off the South American coast into Africa, and then into Asia is apparent, pulling moisture into Africa.

Rotating the 250 hpa/mb view to the Pacific, one sees the reason for the major incursion of warmer air into the Arctic over Siberia, as the polar jet streams up into the Arctic, then loops back into the Pacific in interaction with the sea surface temperature anomaly in the northeast Pacific.

From the perspective of Central Asia (below), the mid-latitude jet appears generally "nomral", however, the Arctic jet stream double dips into Siberia, helping to hold the polar air mass in place, but also bringing unseasonable cold to areas of central Asia and into the Pacific, attested by the unusual snow storm in Tokyo.

At 500 hpa/mb, the pattern again is meandering with a cutoff circulation in the Canadian Arctic. The low pressure affecting the UK is now quite visible, as well as the strong low in the North Pacific, that is feeding off circulation from the Arctic basin.
When viewed from the Pacific, the 500 hpa/mb mid-latitude jet streams across south Asia and into the Pacific as generally expected. The Polar Jet writhes across Siberia and Asia like a dying snake.

The 500 hpa/mb jet reconstitutes over Korea and is driving the cold weather into Japan before abruptly turning north into the Pacific then turning northwest into eastern Siberia before looping over the East Siberian Sea, providing the steering for anomalously warm air masses into eastern Siberia before wrapping around the low in the northern Pacific.

The Polar view of the 500 hpa/mb jet stream in the NH looks like a Van Goh painting run amok.
http://earth.nullschool.net/#current/wind/isobaric/500hPa/orthographic=-358.75,80.29,441The 750 hpa/mb view reflects the steering currents at the upper levels of the troposphere. While the jet seems normal across the US - bringing rain and snow into California and Oregon - now turning into flooding after drought in northern California, but also directing storms across the Northeastern US - which does not need more. What is of concern is how the jet falls apart as it gets into Europe.

The 1000 hpa/mb depicts the same pattern, even more obvious glaring absence of major wind flow across Europe.

The surface wind pattern is focused on the storm currently bashing the UK. However, my conclusion is that this mangling does reflect the larger dynamics at work - that warming is resulting in disruption. As a point to this survey, it is 25F where I am in the US. It is 32 F/0 C in Tunu, Greenland.
No comments:
Post a Comment